data.title Benchmark

Advertising Benchmarks: Know Where You Stand & Gain an Advantage

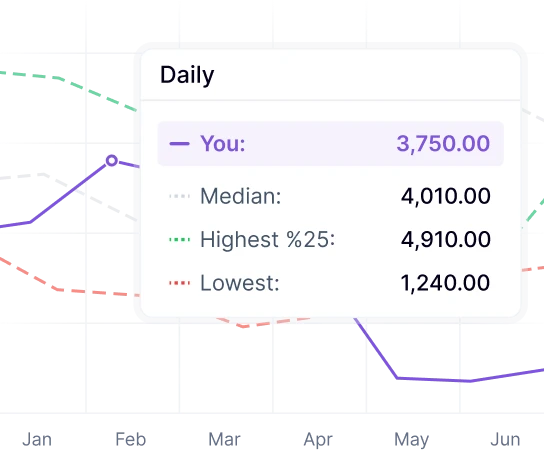
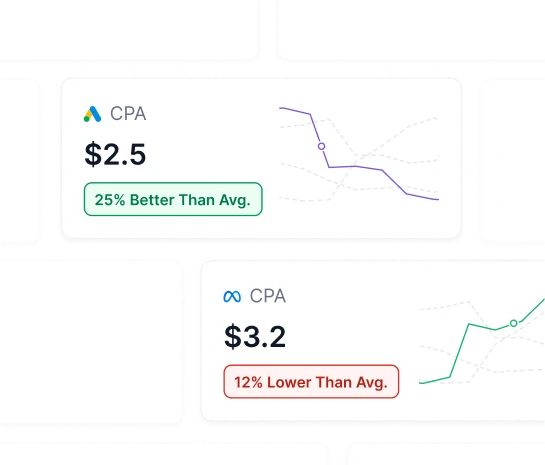
Benchmark your Meta ad performance against similar businesses. Analyze key metrics, identify areas for improvement, and explore opportunities to optimize your strategy.

Competitor Hero
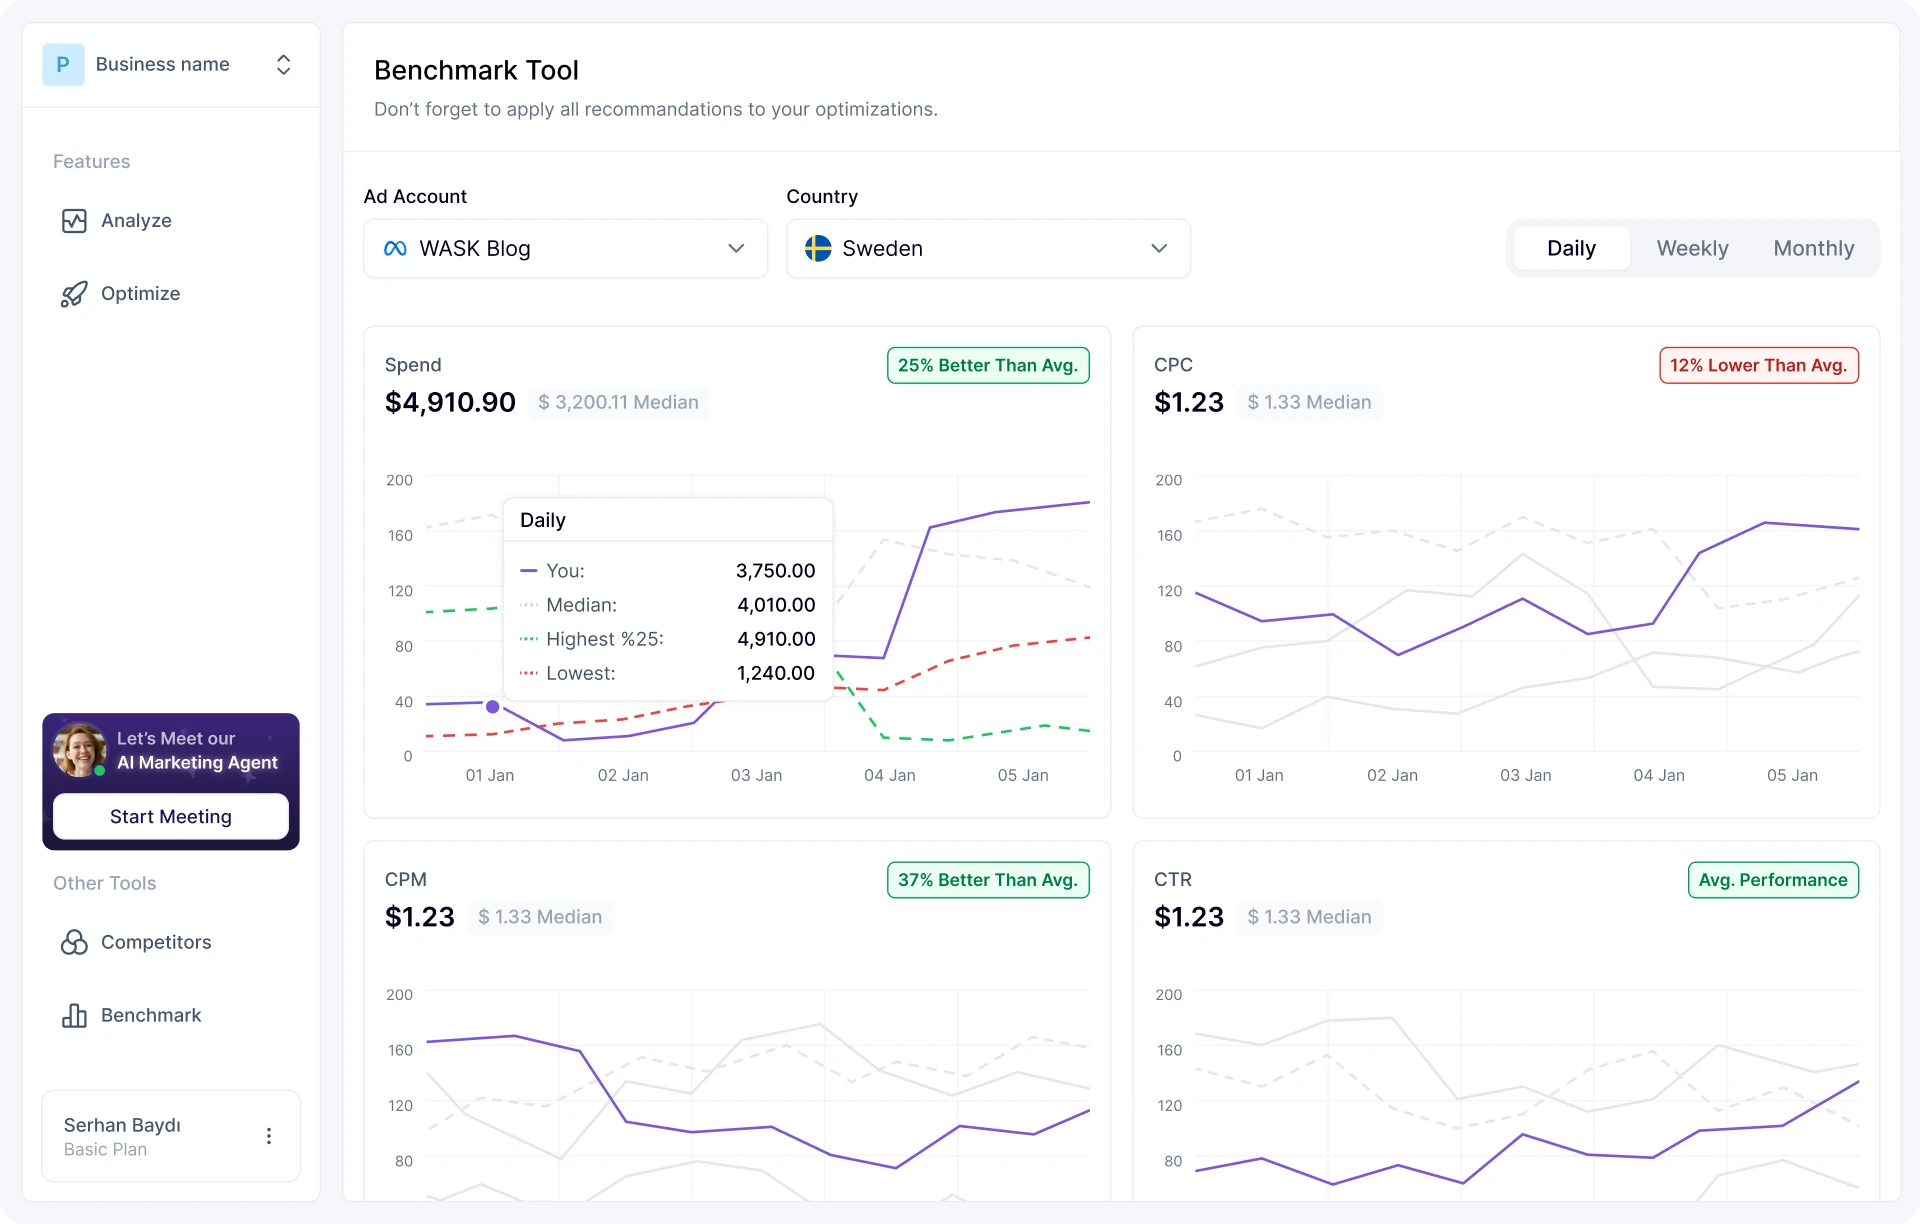
Compare, Optimize, Succeed

See the Standards, Set Your Strategy

Detailed ad account dataMobile detailed ad account data

Detailed Ad Account Metrics Comparison

Find out where you stand in the market by comparing your ad metrics to similar businesses. Use these insights to optimize your Facebook campaigns.

Actionable performance insightsMobile actionable performance insights

Actionable Performance Insights

Turn benchmark data into meaningful actions. Identify gaps, improve your metrics, make informed decisions and optimize your Meta ads effectively.

Country-specific benchmarking dataMobile country-specific benchmarking data

Country-Specific Benchmarking

Pick a country to compare your metrics with similar businesses. Use country-specific benchmarks to align your strategy with local dynamics.

Insights into key ad metricsMobile insights into key ad metrics

Insights Into Key Ad Metrics

Analyze critical metrics like reach, click-through rates, and conversions to understand your ad performance. Create more effective ad strategies.

Try WASK Risk-Free

Start 14 Day Free Trial

Experience WASK’s next-generation ad optimization and
actionable insights with our free trial. Optimize and analyze your
digital ads and boost your results without commitment.

FAQ

Frequently Asked Questions

What are benchmarks in advertising?

Benchmarks in advertising are industry-standard performance metrics that allow businesses to compare their ad campaigns against similar advertisers. Industry benchmarks provide clear data on what’s considered a good click-through rate (CTR), cost per click (CPC), conversion rate, and return on ad spend (ROAS) within a specific industry. Advertisers can use PPC benchmarks to determine whether their campaigns are performing well or need improvement. For example, if your CPC is significantly higher than the digital benchmarks by industry, it may indicate that your targeting or bidding strategy needs optimization. Similarly, if your conversion rate is lower than the average, adjustments to your landing page or ad messaging might be necessary. With WASK Benchmark, businesses can compare their Google Ads and Facebook Ads performance with industry benchmarks for digital marketing. This helps them make smarter decisions, optimize their strategies, and improve their ROI. Digital benchmarks serve as valuable guides for measuring success and optimizing advertising efforts.

What are Google Ads benchmarks?

Google Analytics industry benchmarks are average performance metrics that advertisers use to compare their campaigns against industry standards. These benchmarks help businesses understand how well their ads are performing and identify areas that need improvement. Key Google Ads benchmarks include:

  • Click-Through Rate (CTR): The percentage of users who click on a Google ad after seeing it. A higher CTR indicates that the ad is relevant and engaging.
  • Cost Per Click (CPC): The average amount paid for each click on an ad. CPC varies based on industry competition and keyword demand.
  • Conversion Rate: The percentage of users who take a desired action (such as making a purchase or signing up) after clicking on the ad.
  • Return on Ad Spend (ROAS): The revenue generated for every dollar spent on advertising.
These industry benchmarks for web analytics vary by industry, campaign type, and target audience, making it important to compare your performance with businesses in your sector. With WASK Benchmark, advertisers can track their Google Analytics benchmarks by industry, compare them to industry averages, and receive insights to optimize their campaigns. This ensures better ad performance, improved ROI, and smarter budget allocation.

What are Facebook Ads benchmarks?

Facebook Ads benchmarks are standard performance metrics that help advertisers compare their campaign results to industry averages. These Facebook benchmarks provide valuable insights into how well an ad is performing on Facebook and Instagram, allowing businesses to adjust their strategies for better engagement, lower costs, and higher conversions. Some key Facebook Ad benchmarks include:

  • Click-Through Rate (CTR): Measures how often users click on your Facebook ad after seeing it. A high CTR suggests that the ad is relevant and compelling.
  • Cost Per Click (CPC): The average amount spent per click. CPC varies depending on audience targeting, competition, and ad relevance.
  • Cost Per Mille (CPM): The cost of 1,000 ad impressions. This metric helps advertisers understand how much they’re paying to reach their audience.
  • Conversion Rate: The percentage of users who take a specific action (purchase, sign-up, etc.) after clicking on an ad.
  • Engagement Rate: Tracks likes, shares, comments, and other interactions to measure how well an ad resonates with the audience.
These Facebook advertising benchmarks can differ across industries, ad placements, and objectives, making it essential to compare your performance with similar businesses. With WASK Benchmark, advertisers can monitor their Facebook Ads performance and see Facebook industry benchmarks, compare results with industry standards, and receive AI-powered insights to optimize their campaigns. This ensures efficient ad spending and improved marketing success.

How do Google Ads and Facebook Ads benchmarks vary across different industries?

Google Ads and Facebook Ads marketing benchmarks differ significantly across industries because each sector has unique audiences, competition levels, and user behaviors. What works for one industry may not necessarily apply to another, making it crucial for advertisers to compare their CTR, CPC, conversion rates, and ROAS within their specific market. For Google Ads, industries with high search intent, such as legal services, finance, and healthcare, tend to have higher CPCs because businesses are willing to pay more for competitive keywords. Meanwhile, industries like e-commerce and travel often have higher conversion rates since users searching for these products are already interested in making a purchase. On Facebook Ads, PPC benchmarks vary based on audience engagement and ad placement. Industries such as beauty, fashion, and entertainment typically see higher engagement rates and lower CPCs due to visually appealing content and audience interest. However, industries like B2B services or technology may face higher CPCs and lower engagement rates, as their audience often requires more time and information before taking action. With WASK Benchmark, businesses can compare their ad performance within their specific industry, analyze trends, and receive insights to optimize their campaigns accordingly. Instead of using generic digital marketing benchmarks by industry, WASK ensures you measure your performance against the most relevant data for your business.

What are the average click-through rates (CTR) for Google Ads and Facebook Ads?

Click-through rate (CTR) is a key performance metric that measures how often users click on an ad after seeing it. However, CTR industry benchmarks vary based on platform, industry, and ad type, making it important to compare your performance with relevant data. For Google Ads, the average CTR for search ads typically ranges between 3% – 6%, as users are actively searching for relevant products or services. Display ads tend to have lower CTRs, around 0.5% – 1%, since they are more passive and focused on brand awareness. When it comes to Facebook Ads, CTR benchmarks depend heavily on industry and ad placement. On average, Facebook CTR benchmarks range between 0.9% – 1.6%, with carousel and video ads often performing better than static images. However, click-through rate benchmarks by industry show that some sectors, such as retail and beauty, tend to have higher CTRs due to visually engaging content, while B2B or tech-related industries may experience lower engagement. Using WASK’s Benchmark feature, advertisers can compare their CTR against industry CTR benchmarks, track performance trends, and optimize their ad creatives for better engagement. By aligning with click-through rate benchmarks by industry, businesses can optimize their ad strategies and improve overall campaign effectiveness.

What are the average cost per click (CPC) metrics for Google Ads and Facebook Ads?

Cost Per Click (CPC) is a key metric in digital advertising, influencing how much businesses pay to drive website traffic. However, CPC rates vary across industries, making it essential to compare your performance against website traffic benchmarks by industry to ensure your ad spend is optimized. For Google Ads, the average CPC depends on the search intent and competition level:

  • Google Search Ads CPC typically falls between $1 – $3, but in highly competitive sectors like finance, law, and insurance, it can exceed $10 per click.
  • Google Display Ads CPC is generally $0.50 – $1, as display campaigns focus more on brand visibility rather than direct conversions.
For Facebook Ads, CPC is usually lower than Google Ads but fluctuates based on ad format and industry:
  • Facebook Ads CPC ranges from $0.50 – $2, with industries like technology, B2B, and finance experiencing higher costs due to audience competition.
  • Ad placements and creative formats impact CPC, with video and carousel ads often delivering lower costs compared to direct lead-generation ads.
To ensure your ad spend aligns with website benchmarks, using WASK Benchmark allows you to compare website benchmarks by industry, analyze CPC trends, and refine your bidding strategy for better cost-efficiency. Tracking CPC benchmarks ensures businesses allocate their budgets wisely while maximizing ad performance. What are the average conversion rates for Google Ads and Facebook Ads?  - H2 Conversion rates measure how often users take a desired action—such as making a purchase, signing up, or filling out a form—after clicking on an ad. However, conversion rates vary based on industry, ad type, and platform, making it essential to compare your results with ROAS benchmarks, e-commerce benchmarks, and B2B digital marketing benchmarks to optimize performance. For Google Ads, conversion rates are typically higher for search ads because users actively look for solutions:
  • Google Search Ads have an average conversion rate of 3% – 5%, with industries like legal, finance, and healthcare often seeing higher rates.
  • Google Display Ads have a lower conversion rate of around 0.5% – 1%, as these ads focus on brand awareness rather than direct intent.
For Facebook Ads, conversion rates depend on audience targeting and ad engagement:
  • E-commerce benchmarks show that Facebook Ads conversion rates typically range from 1% – 3%, with industries like fashion and beauty performing better due to visually engaging ads.
  • B2B digital marketing benchmarks suggest that B2B Facebook Ads conversion rates are often lower, around 0.5% – 1.5%, as businesses require more nurturing before making decisions.
Tracking conversion rates alongside ROAS benchmarks helps businesses understand whether their ad spend is delivering a strong return. With WASK Benchmark, you can compare your Google Ads and Facebook Ads conversion rates against industry averages and receive data-driven insights to improve your ad strategy, optimize landing pages, and boost overall performance.

Is WASK Benchmark free?

WASK Benchmark is included in all WASK plans, giving users access to valuable insights for comparing their ad performance against industry standards. While it is not entirely free, WASK offers a 14-day free trial, allowing you to explore its capabilities before committing to a subscription. Are you wondering ‘what are industry benchmarks?’. During the trial period, you can analyze key advertising metrics like CTR, CPC, conversion rates, and ROAS, helping you understand how your Google Ads and Facebook Ads perform in comparison to marketing benchmarks by industry. These insights enable businesses to optimize their campaigns, optimize their strategies, and improve ad efficiency. For continued access to advanced benchmarking tools, competitive analysis, and AI-driven recommendations, upgrading to a paid plan ensures you get the most out of your advertising efforts.

What are the available filters for analysis?

The WASK Benchmark tool allows you to filter data by industry and ad account, ensuring that your analysis is tailored to your specific business and market needs.

  • Industry Filter: Compare your ad performance with businesses in your sector to see how your CTR, CPC, conversion rates, and ROAS measure up against industry standards.
  • Ad Account Filter: Analyze benchmark data for specific ad accounts, enabling a more focused review of your campaign performance.
These filters help advertisers gain precise insights, track trends, and make data-driven decisions to optimize their Google Ads and Facebook Ads campaigns effectively.

Can I save my benchmark data?

No, the WASK Benchmark feature does not currently allow users to save data. However, you can revisit the tool anytime to perform new analyses and access the latest insights. Since social media industry benchmarks change over time based on industry trends and advertising performance, using real-time data ensures you always have the most up-to-date metrics for your Google Ads and Facebook Ads campaigns. By regularly checking the tool, you can monitor shifts in CTR, CPC, conversion rates, and ROAS to keep your advertising strategy optimized and competitive.

Do you give suggestions based on my benchmark?

No, the WASK Benchmark feature does not provide direct suggestions. However, you can use the AI Marketing Agent to receive personalized guidance based on your benchmark data and overall campaign performance. By analyzing your ad metrics, the AI Marketing Agent can help you identify areas for improvement, suggest optimization strategies, and guide you in making data-driven decisions. This ensures that you not only compare your performance against industry standards but also receive actionable insights to optimize your Google Ads and Facebook Ads campaigns effectively.